
By Luke Glasner
We often hear that we should send the right message to the right person at the right time in email marketing; but how do you find the “right person”? The answer is segmentation, but to really find the right person you have to go beyond just simple activity or purchase segmentation to more advanced techniques. This is where subscriber personas and profiles come into play. The persona tells you WHO the person is so you can create the right message to reach them.
Building subscriber personas can help you improve your email marketing by giving email marketers, and the creative team, a deeper understanding of who your subscribers and customers are. Personas can be used in email marketing in many ways such as: increasing engagement, guiding content and creative production, setting the foundation for personalization or dynamic content, and most importantly, increasing email conversion and revenue. In fact, using personalization techniques like subscriber personas, can lead to increases in conversion rates of 10% and a 20% increase in sales vs. non-personalized emails, per Campaign Monitor (2020).
One of the classic ways to build subscriber personas is to use cluster analysis to find what I call natural subscriber segments. Broadly, Cluster Analysis is a statistical technique that uses your data to group people based on their similarities. After the initial groups are formed, it uses an iterative process to repeat the sorting steps refining the group’s membership until it stops changing and membership stabilizes. This image below helps to illustrate the process of sorting data into clusters.
Here’s how it works: first it splits people into clusters (groups) and determines the mean (the average) for each variable in the data set. Then based on the distance of the subscriber’s values from the mean, it groups them to cluster with the closest means overall. Once everyone is split into groups, it calculates new means for each cluster and then repeats the process. After several iterations the cluster’s membership will stop changing and will coalesce into unified groups. Upon completion most stats programs will provide means for each variable used in the cluster analysis as the output along with the cluster model itself. These variable means are the description of the group such as joined the list 6 to 12 months ago, clicked in the last 90 days, gender, repeat customer, annual spend between $100 and $500, lives in Northeast, etc.
Not all variables are equally suited for clustering. I find that the variables that have a strong impact on group membership are often related to recency such as time on file, time since last click, time since last purchase, etc. These variables along with demographic data such as gender, race, income, education, industry, etc. are used to flesh out the persona. When running our cluster analysis, we want to be able to use demographics and similar categorical data. Hence we need to use the K-Means procedure for clustering, as that allows you to work with variables using categorical data as opposed to other clustering procedures. I typically run this analysis in IBM Statistics (SPSS) or a similar stats analysis tool like SAS or Python. This is different from the clustering procedure used in visualization tools like Tableau which do not use the K-Means method. Once the clusters are run and you have your mean values for each variable you can use those together to build a profile of the “average” subscriber in the cluster. Each cluster (typically 3 to 5 depending on list size) will represent one archetype of subscriber in your list.
Let’s walk through an example that I did with a client in the past. This client ran an online job board and was experiencing a decline in both clicks and applicants to featured jobs. Opens were strong, so people were reading the emails but not applying to jobs. We had unusually high coverage on demographic indicators to work with, such as education level, job seniority, employment status, etc. since these were all shared during the job application process. We also had a lot of email activity indicators like how often they opened or clicked, how recent it was, their join date, etc. Armed with my prepped data I started to run the clusters.
One thing I did that resulted in clearer differences between the resulting profiles was to run computed time variables as different periods (i.e., days vs weeks vs months). For this data set weeks was the best period to use as it resulted in the clearest splits. I tried different combinations of variables and different numbers of clusters to find the cluster model that was the strongest to use to build my personas. I ran about 25 cluster models to find my final one. If I had an AI tool at the time, that probably would have done all the different combinations for me. Some of the demographics don’t fit well as binary variables nor can they be ranked really. For those, I used the mode rather than the mean to build my persona or profile definitions that became the project’s output.
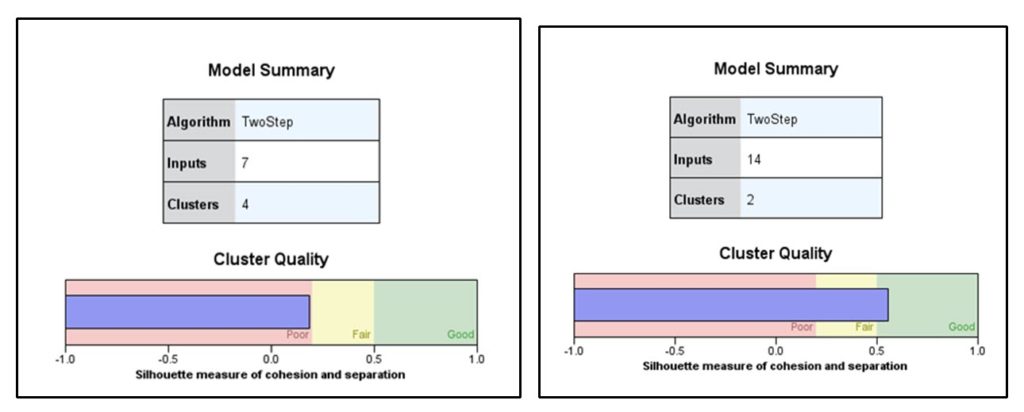
The model on the right led to one of my major insights during the process. I discovered there were really two core audiences here and from there I was able to refine the cluster for greater quality. Once I understood the two major audiences, I was able to get to four clusters with strong quality scores by basically splitting the main segments into subgroups. Those became my four major personas.
One audience was job seekers that signed up during the economic downturn the previous year and were typically mid-career job seekers. The other was mostly college students or recent grads that recently joined the list. As the economy improved the people in audience 1 found jobs and were replaced by newer subscribers that were the new college grads. Since the historical majority had been the mid-career audience, this resulted in the mismatch between the types of employers that their sales team was targeting as well as types of jobs being featured in email job alerts. As a result, new subscribers were not getting the kind of content they wanted so they became disengaged faster or never really engaged. By recognizing how the audience was changing in response to the labor market conditions they were able to create a much better fit between their content and their subscribers resulting in a big uplift in email engagement and jobs filled.
From this project I learned that to really understand what was happening, I needed to contextualize my thinking and analysis. That’s how I made the realization about the two audiences and their goals to find the major insights from the analysis. To help flesh out the subscriber personas, one tactic was to use descriptive statistics like mode and frequency for some of the demographic variables when building my persona. Running those procedures tells you the most common industries or job titles for the people in the cluster once they are assigned. Those same variables usually didn’t make very good inputs for the clustering itself, rather they helped to flesh out the personas once I had the clusters. Another application of the cluster variables was to use some of the stronger variables for additional recommendations, such as timing of re-engagement for the four major segments.

Next, I used imagery to personify the types of job seekers. The image above was one I used for our “new college grad or student” profile. To be effective you need to go beyond just reading the list of cluster means and spitting out a list of demographics. Instead pick a fictional character or person that embodies those characteristics. This gives you, or your creative team, a solid idea of who you are writing to and hopefully what those subscribers will respond to. This article by OI member Kath Pay is one of the few with actual examples of subscriber personas in it that I could find online.
Using the cluster analysis and resulting subscriber personas, we were able to identify the cause of decline clicks and job applications. Namely the major shift in audience due to the changing economic environment. Using the personas the client was able to align both of the major stakeholders – the employers that sales were courting and the job seekers that were receiving the emails. Sales was able to focus more on employers that offered the types of jobs their audience could apply to. It also allowed them to more effectively personalized their emails based on the major subscriber types. While specific jobs could be picked using an algorithm, understanding the audience allowed them to also produce better creative for the audience. The audience’s preferences around tone, layout, and even things like font faces, can be quite different for college students than middle aged managers and directors. I hope you will try building subscriber personas for your own list using Cluster Analysis. Your understanding of who the people in your audience are will grow by leaps and bounds, even if you can’t find the perfect cluster model. Often, like I learned in this project, our best insights come not from finding success on the first run, but from the learnings we get working the analysis to find relevant results. Plus with the big increases in engagement, sales, conversions and other important KPIs, it is well worth your time to build personas for