
Click Reach Rates are between 0% and 100%; once you finish the equation, turn your answer to a percentage by multiplying by 100. Unlike Click-through Rate, which gauges performance on a single email message, Click Reach Rate shows you what unique percentage of your list clicked on at least one of a series of email messages.
For instance, let’s say you sent a series of three email messages, and your unique click-through rates were 3.1%, 2.7%, and 2.8%. You would want to know whether:
- Each of these people only clicked on one of these email messages, meaning that 8.6% of your list (the sum of the three unique click-through rates) clicked on at least one of your messages.
- The 2.7% and 2.8% of people who clicked on messages 2 and 3 were subsets of the 3.1% who clicked on message 1, meaning that only 3.1% of your list was engaged with this series
- The truth lies somewhere in between.
Reach Rate can tell you whether the answer is A, B, or C — and if it’s C, it can tell you exactly what percentage of your list clicked on at least one link in this series.
Calculating Click Reach Rates
I wish it were easier (I’m talking to you, ESPs), but the way to calculate reach rates is to consistently dedup those who clicked on your latest sends against those that clicked on the previous sends.
Here’s an example:
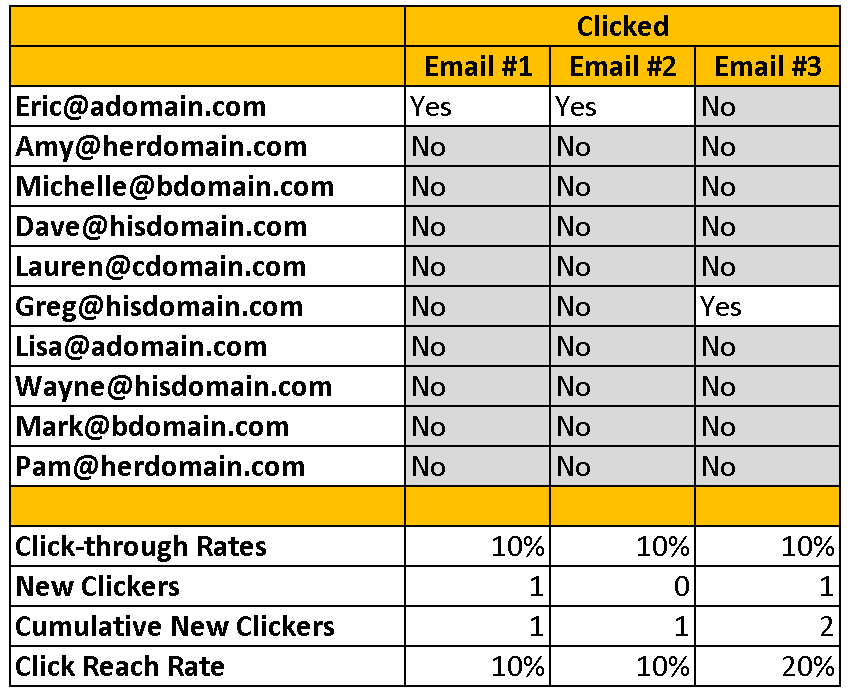
Now, you most likely have more than 10 people on your email list. And you likely don’t have click-through rates of 10% on every send. But you get the idea. Click reach only counts new clickers – not people who have clicked on previous emails in the series.
Tips for Interpreting Click Reach Rates
Click Reach Rates should only be calculated when the same people are receiving each email in the series; you can’t calculate Click Reach when you send the first email to 1M people in group A and then the second email to group A plus another 500,000 from group B.
Click Reach is most valuable when you are looking to gauge the success of a series of related emails, not a group of unrelated messages.
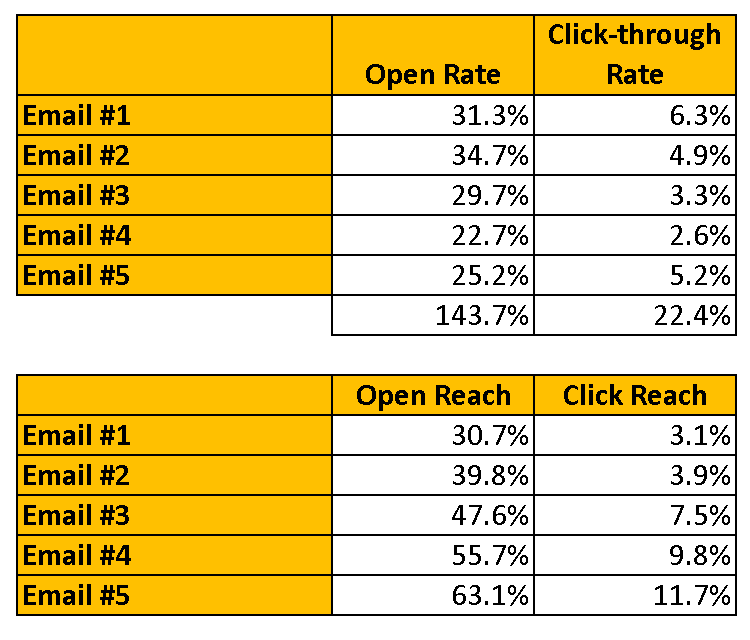
Click Reach is most often reported as a graph like the one below, in conjunction with Open Reach.
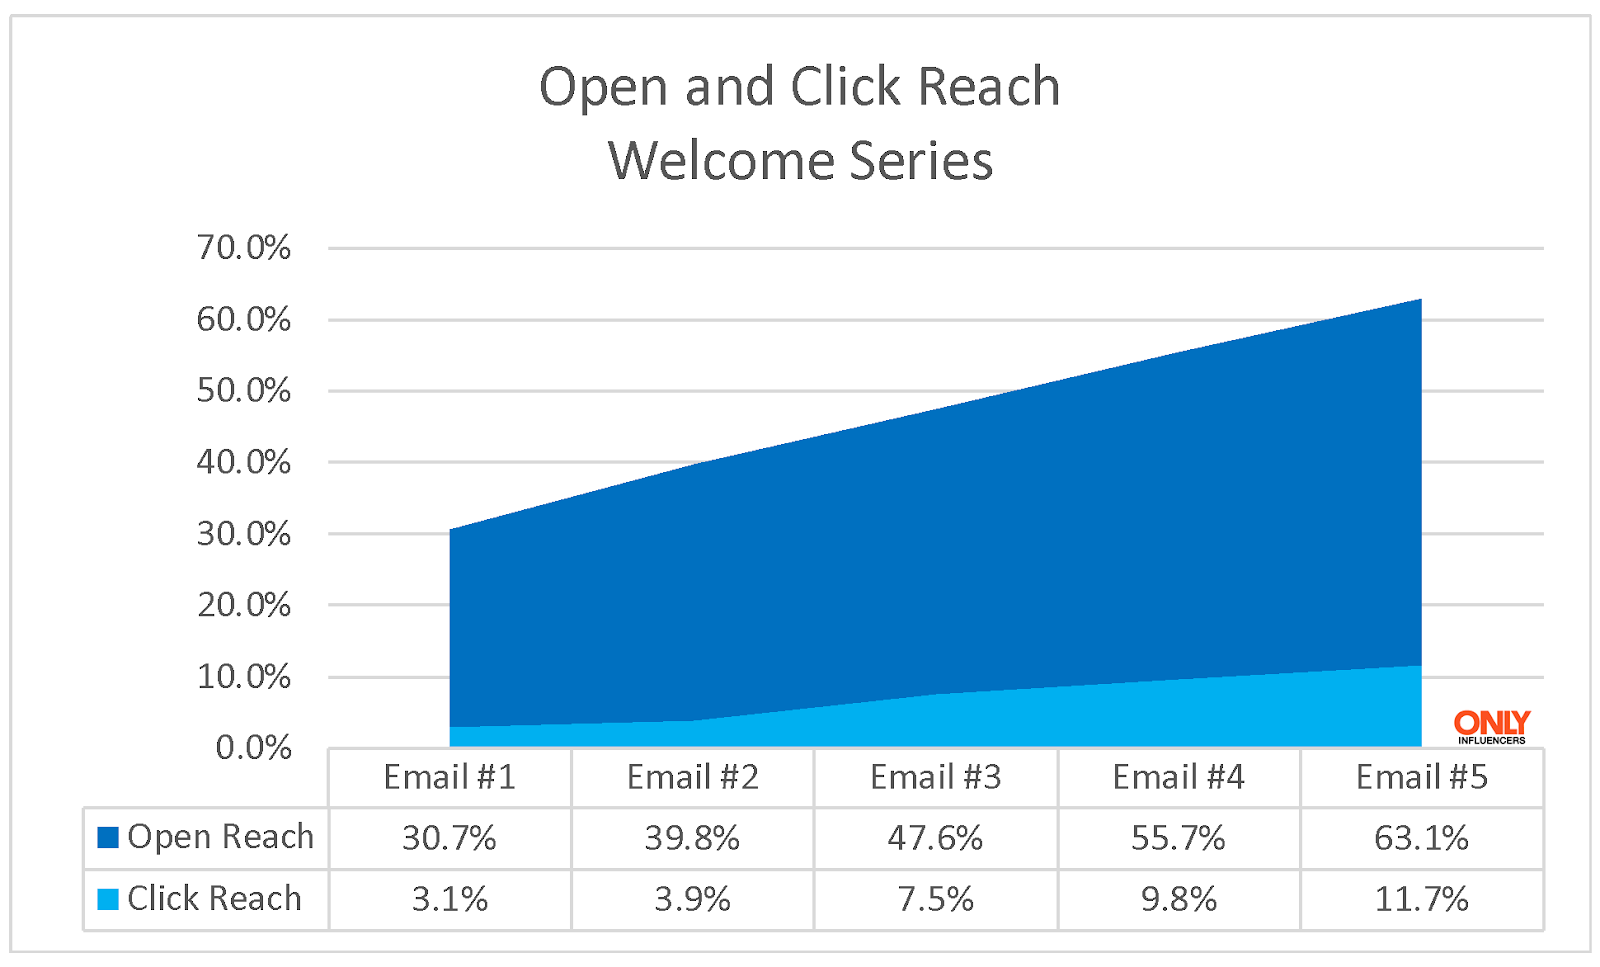
Here is the data that led up to the graph above, counting only new, not repeat, clickers in the click reach figure.
See our other articles for examples of other metrics based on clicks like Click-through Rate and Click-to-open Rate.
Click Reach Rates show you how engaged the people on your list are. While Click Reach Rate isn’t the end goal, it’s a step toward the end goal — and by boosting your Click Reach Rate, you can often see a lift in Return-on-Investment (ROI), Revenue-per-Email (RPE), and other business metrics.
Related Links
I wrote about Understanding and Leveraging the Power of Open and Click Reach Rates in Email Marketing for the Webbula Metrics Series in early 2021.
Back in 2013, the DMA UK also published on the topic in Email Engagement: Often Talked About, Never Defined.