By Luke Glasner
Segmentation is one of the keys to email marketing success and most email marketers segment their lists when sending. Did you know you should also segment your results? Segmenting your results allows you to answer questions about your email program, leading to actionable insights for you and your marketing team. Let’s talk about what data you’ll need and then go through some examples of how to put segmentation in reports to work for you.
To start, gather your email (opens, clicks, etc.) and conversion (revenue, number of sales, etc.) data along with relevant information on send dates. From here you can calculate any rates you need, including open rate, click-through rate (CTR), and conversion rate (CR). You can also calculate time variables like length-of-time on file, time-based cohorts, or lifespan for customers and subscribers. I like to work in analysis or visualization tools for this, as I can automate data retrieval and updates via API. We will often need to get to a level of granularity that’s not easy to export and assemble into a data set of individual subscriber actions. If there’s no faster option, you can export all the data campaign-by-campaign and then merge it together, but that’s time consuming and will likely require tools beyond just Excel. Now that you have your data, let’s move onto some examples.
What percentage of my subscribers are actively engaged with my list?
Let’s start with reach metrics, as those are the easiest to build and review. I used to recommend calculating both open reach and click reach metrics, but Apple MPP has rendered calculating open reach ineffective. More on Apple MPP here from OI. You can calculate click reach numbers easily by creating a segment in your ESP of anyone that’s clicked in any message for a given date range, typically a month or year. Here’s an example using simple segment counts from my ESP. The acquired segment gives the count for the people that joined during the year, then I get a count of how many of them clicked during that same year using the clicked segment.
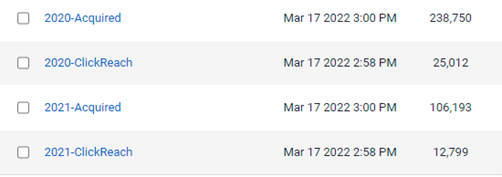
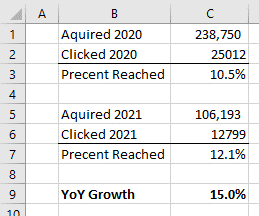
Next, I use those numbers to calculate the amount of people I reached during the year I acquired them. Here I am splitting out the years so I can compare Year over Year.
While this will get you started, it’s not focused enough to really be actionable, so now layer in additional conditions for your segmentation, such as type of email (triggers vs. broadcast) or signup source to start to find insights. For example, if click reach is declining in an automated series but volume remains fairly stable for both periods, then that series likely needs to be reviewed.
How do more recent subscribers perform compared to those who have been on the list a while?
Time based cohorts are a similar segmentation tactic for reporting. For this, gather your data and then segment your list by subscriber sign up dates into periods, typically months or quarters. Now you can see how different groups over time are reacting to your emails which can generate a lot of Insights. For example, an area of interest in your newsletter or best seller product heavily featured in emails are no longer effective for older subscribers due to fatigue. Perhaps lifespan or interests have changed before and after the start of the pandemic. Time based analysis can also be useful to tell when people are likely to disengage and exit the program, so you can time re-engagement efforts better.
Do I have a significant number of seasonal or occasion-based purchasers on my email list?
If you have a few years of purchase history you can try another time based segmentation, which is to understand who are seasonal or occasion-based shoppers, that really only buy around specific times of the year. Understanding who the seasonal or occasion-based shoppers are in your list and when they tend to shop can help you optimize their content or offers during that active period along with different frequencies used during the rest of the year.
Do some offers work better than others during some time periods or macro-events?
You can also use this to look at offers to see if different types of offers work better with subscribers during a specific time period. This helps to understand the impact and change from major external factors that change behavior. For example, early in the pandemic when online shopping bloomed, consumers were more motivated by content around product availability, because their main concern was scarcity. As we move out of the pandemic, scarcity is less of a concern, but rising prices are forcing consumers to have more price sensitivity, thus driving consumers to focus more on discount offers over availability. The key here is not only to split up results into time-based cohorts, but to think about the major events happening at those times to add context to their behavior. Too often we look at email behavior in isolation and don’t really add the context that would explain those behaviors. Or to put into more technical terms, we don’t control for outside forces which may violate our assumptions and cause faulty conclusions. For example, the conversion rate in the early pandemic went up not because we changed the CTA copy but because the major change in the environment (stores are closed) caused the increase. Here we falsely assumed that the test variable caused the change, but in reality it was an environmental factor that was the cause.
Do email addresses from some sources work better than email addresses from other sources?
The last example of segmenting results is to segment reports on Email Source. This is a fairly easy but powerful segmentation tactic, especially for B2B senders that send or use email lead gen or affiliates to drive signups for the email program. This can be very effective for reviewing affiliates or quarterly reviews of types of subscribers being driven by other channels to email.
Can you identify sources of email addresses where initial strong performance is not an indicator of long-term performance?
Go beyond just looking at results by email source, by building a crosstab of source and lifespan (signup date) to find more insights. Here’s a common situation I have seen with my clients. Many marketers find that an affiliate that’s a great subscriber source in the beginning, doesn’t hold up over time. When you first start, you get fresh new names that are very targeted and convert well. But there’s a limit to how many are in the database and they tend to fatigue fast as well. As a result, often the vendor doesn’t have more great (targeted) people left, so they go to less targeted audiences to up the volume and to continue to deliver on required CPMs for new names or acquired customer totals. Since these are less targeted people, they are less likely to actually convert and can negatively impact sender reputation, reducing effectiveness and turning the source into wasted budget over time.
Can granular details about the email sign-up predict ongoing email performance?
A similar analysis that’s more B2C orientated, is to go deeper into possible sources. For example, if one of the main sources of email address is acquired at checkout, start to group them by product purchased and then analyze that over time. Are there certain products that tend to be one and done sellers? Look to repeat buyers to find what they typically buy next that you can feature in a repeat purchase series. For subscriber sign ups, look at different channels or keywords that lead to sign ups (and conversion) in SEO or SEM and put some spend behind them to capture people who normally convert in the near future. You can also use Look-A-Like audiences to do this, but first you need the analysis to define them. This type of analysis can be good for more considered or higher priced purchases as opposed to impulse or low-priced products that tend to either convert immediately or not at all.
Final thoughts on using segmentation to improve your reporting.
The examples above give you good starting points for your program and illustrate how even simple segmentation in your report can provide a wealth of insights. Build a few of these analyses to determine what data you need vs. what you have, so you can start working on increasing coverage with accurate data. For example, tagging cohorts in your ESP for analysis or using a value in append to split out clicks by specific groups. Now that you have the data, start tracking the most impactful across all regular email reporting. It can take some effort to get in place, but looking beyond just campaigns or summary reports will allow you to understand your subscribers’ behavior and optimize your program.