You’ve done your A/B split test! The results are in! There’s a clear winner – but what’s the best, most concise way to report out on the results?
Not a Great Way to Report Results
You could just walk through it in detail…
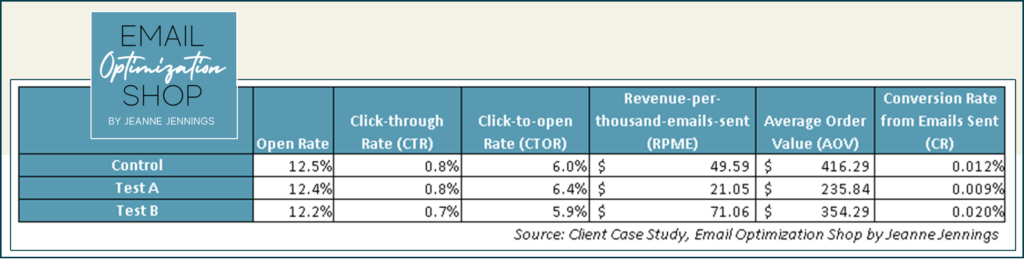
“The control generated an RPME of $49.59, while test version A generated an RPME of $21.05, and the RPME on the test B version was $71.06, so test B won!
“One reason that test B won is that it had the highest CR from sent; 0.020% compared to 0.012% for the control and 0.009% for test A.
“But the AOV for test B wasn’t the highest. It was $354.29, while the control AOV was $416.29 and test A generated an AOV of $235.84.
“There was a little variance in open rates; 12.5% for the control, 12.4% for test A, and 12.2% for test B. The CTRs were nearly the same; 0.8% for the control and test A, 0.7% for test B. And test B actually lagged behind both the control and test A on CTOR; 5.9% for test B, compared to 6.0% for the control and 6.4% for test A.”
“So, like I said, the control won!”
A Much Better Way to Report Results: Lift/Loss
Or you can calculate the lift/loss, and use that to report the results.
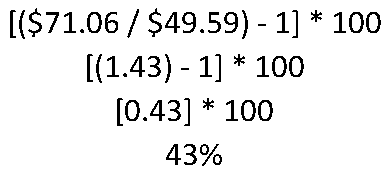
Here’s the formula to calculate lift/loss:

Let’s calculate the lift/loss for the RPME, test B over the control, using the formula above:
One more note about lift/loss; we always calculate it relative to the control. The control data is always in the denominator. If you don’t have a true control, you designate one of the tests as the control.
We don’t need to know how the test versions compare to each other when we report it out. We just need to know which one had the best performance against the control. And if they both show negative lift/losses over the control, then the control is the winner.
Now let’s see how this sounds when we report it.
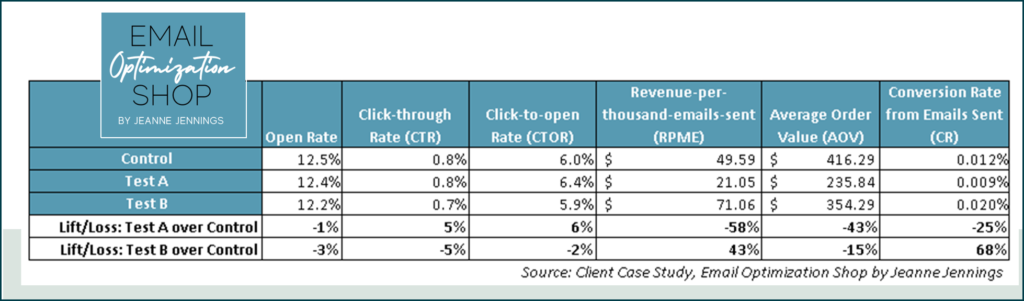
“Test B showed a 43% lift in RPME over the control; it was the winner. Test A actually depressed RPME, generating a 58% loss over the control.
“Test B’s CR from sent was the reason it won; it was 68% higher than the control’s CR from sent. Once again test A lagged the control here, this time by 25%.
“Both test A and B showed a loss in AOV compared to the control; 43% and 15% respectively.
“Both tests also lagged the control in open rate; by 1% for test A and 3% for test B.
“In CTR and CTOR test A bested the control, by 5% and 6% respectively. But test B lagged the control in CTR and CTOR, by 5% and 2% respectively.”
It’s easier with lift/loss, isn’t it?
But in order to do this, you have to calculate the lift/loss accurately.
A Really Bad Way to Report Results
I’ve seen marketers work off of absolute figures instead of percentages; this ignores the magnitude of the variance, which is critical to understanding how well/poorly the winner/loser performed.
An example appears below – don’t do this!
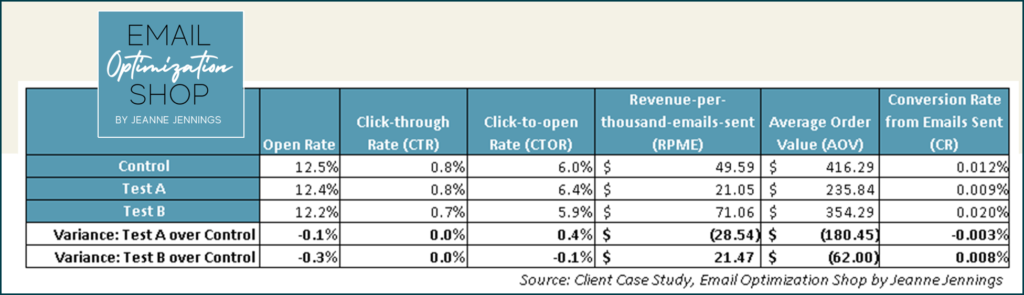
Here’s an example of why this isn’t a good way to report on results.
If we said “test B generated $21.47 more in RPME than the control” we would be correct; but it wouldn’t tell us how good that was.
If the control had generated an RPME of $1.00, and test B had an RPME of $22.47 ($21.47 higher), that would be very good indeed! A lift of 2,147%!
But if the control had generated an RPME of $500.00 and test B’s RPME was $21.47 higher, it would be $521.47. A winner, but only a 4% lift.
It gets even more confusing when marketers use this method to explain lift/loss on percentages. In this case, let’s look at the CR from sent.
A marketer using this method would say that test B generated a CR from sent that was 0.008% higher than the control. That doesn’t sound like much – it doesn’t sound like a 68% lift, but it is.
Closing Thoughts
When you report in absolute numbers, or even straight variances, whether you’re doing it in writing or verbally, the person you’re speaking to has to take an extra step to actually understand the numbers. Either way, they need to figure out the magnitude of the variance, the lift/loss, in their head to put the data into context.
But when you report out lift/loss correctly, they have what they need to understand the data, no mental math needed. Give this a try with your email marketing program and let me know how it goes!
jj

[…] you know from the headline, our revenue-per-thousand-emails sent (RPME) increased by 43%. The control generated an RPME of just under $50 ($49.59) while the test generated more than $71 […]